Insights & AI
Insights, analytics, and Shoppy AI
See how customers find and interact with your stores, get AI insights reports by email, and ask Shoppy AI to look up or update store details for you.
Shoppy Connect records how customers interact with your stores online: where they search from, which stores they look at, when they call or ask for directions, and which products they view. This guide covers the three ways to use that information:
- Insights and analytics: charts and tables on your dashboard.
- Reports: detailed reports you can filter.
- AI insights reports: an AI-written summary sent on a schedule.
It also covers Shoppy AI, the assistant that can look up and update your store details for you.
Insights and analytics
Your Home dashboard and the Analytics page show the same insights. The Home dashboard also shows your latest AI insights report at the top.
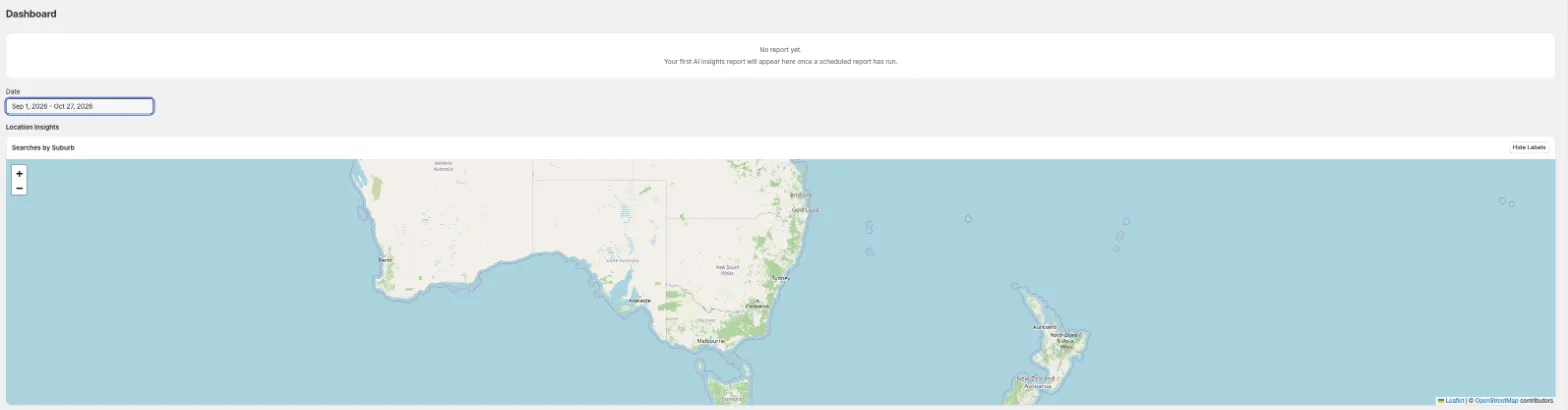
Choose a date range
Use the Date filter at the top to choose the period to look at. Pick Today, Yesterday, or Last 7 days, or click a start date and an end date on the calendar. Every chart and table on the page updates to match.
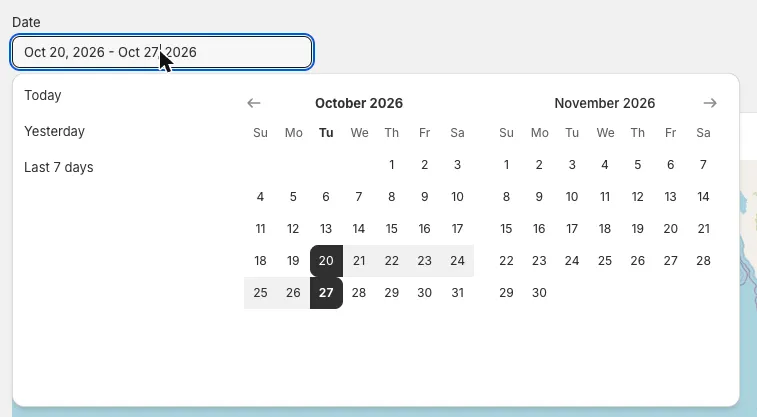
You can also use the store switcher in the top bar to look at a single store, or choose All Stores to see everything.
Location insights
Searches by Suburb is a map of the suburbs customers searched from when looking for a store near them. Use + and − to zoom, and Hide Labels to make the map easier to read.
Use it to see where demand comes from, and to spot areas with lots of searches but no store nearby.
Store insights

- Most Viewed Stores by Store Views: which stores customers look at most.
- Calls by Stores: which stores customers call most from your listings.
- Directions by Stores: which stores customers ask for directions to most. This is a good sign of real visits.
Product insights
- Products by Store Views: which products customers view, by store and device type, with sessions and total views.
- Most Popular Suburb Searches: the suburbs customers search from most, with the number of searches and sessions.
Reports
For more detail, go to Analytics › Reports in the sidebar.

| Report | Category | What it shows |
|---|---|---|
| Location Searches by Suburb | Search Address | A map of searches, plus the top addresses customers searched from. |
| Store Views & Sessions | Store Performance | Your most viewed stores, with sessions and total views by device type. |
| Store Calls | Store Performance | Your most called stores, with the total calls and the date of the last call. |
| Store Directions | Store Performance | Which stores customers asked for directions to. |
| Product / Store Views | Products | Which products customers viewed, and at which stores. |
| Variants / Store Views | Products | The same, broken down by product variant, such as size or colour. |
| Out of Stock Products / Store Views | Products | Out-of-stock products customers are looking for, so you know what to restock first. |
Click a report to open it.

Each report has its own filters. Depending on the report, you can filter by:
- Date: the period to report on.
- Limit: how many rows to show, for example Top 10, Top 25, Top 50, or Top 100.
- Device Type: Desktop, Mobile, or Tablet, or all devices.
- Store, Product Type, and Product Tags: narrow product reports to particular stores or products.
The Summary row at the bottom of each table shows the totals for your filters.
Out of stock products
The Out of Stock Products report shows which products customers searched for or viewed while they were out of stock. Use it to decide what to restock first, and at which stores.

This report depends on up-to-date stock levels. Set how often Shoppy Connect checks your inventory under Settings › Analytics › Out of Stock Report. See Inventory sync for the out-of-stock report.
AI insights reports
An AI insights report is a written summary of how your stores are performing, created for you by AI. It appears at the top of your Home dashboard, and it can be emailed to your team.
Every report looks at the last 30 days, however often it runs.
Until the first report has run, the dashboard shows No report yet.
Schedule the report
Go to Settings › Analytics.
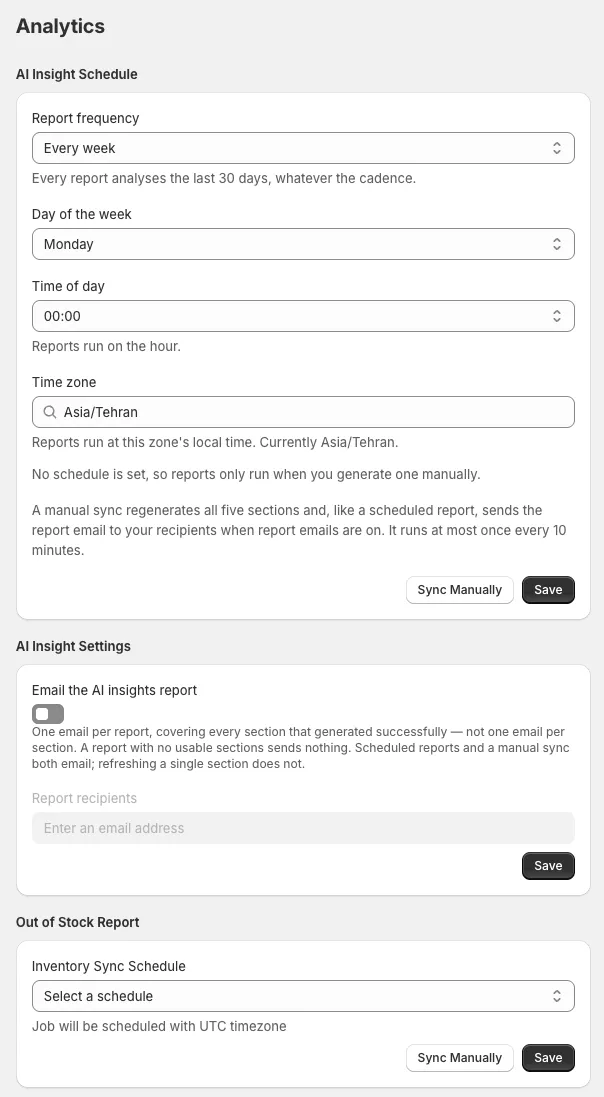
Under AI Insight Schedule:
- Choose a Report frequency:
- Every day
- Every week
- Twice a month (1st and 15th)
- Every month
- Every quarter (Jan, Apr, Jul, Oct)
- Custom schedule (advanced)
- For a weekly report, choose the Day of the week.
- Choose the Time of day. Reports run on the hour.
- Check the Time zone. Reports run at this time zone’s local time, so set it to where your team works.
- Click Save.
If no schedule is saved, reports only run when you create one manually.
Create a report now
Click Sync Manually to create a new report straight away. A manual sync rebuilds the whole report and, like a scheduled report, emails it to your recipients if report emails are on.
You can run a manual sync at most once every 10 minutes.
Email the report
Under AI Insight Settings:
- Switch on Email the AI insights report.
- Add the email addresses that should receive it under Report recipients.
- Click Save.
Recipients get one email per report, covering every part of the report that was created successfully. If no part of the report could be created, for example because there’s no data for the period, no email is sent.
Inventory sync for the out-of-stock report
Under Out of Stock Report, choose how often Shoppy Connect checks your inventory from Inventory Sync Schedule: Daily, Every 7 Days, Every 14 Days, or Every 30 Days. Click Save.
The schedule runs on UTC time. Click Sync Manually to check inventory straight away.
Shoppy AI
Shoppy AI is an assistant built into Shoppy Connect. You can ask it about your stores in plain language, or ask it to update store details for you, instead of finding the right page and field yourself.
Open Shoppy AI
Click the Shoppy AI button (the sparkle icon) in the top bar. The assistant opens on the right of the screen, on any page.
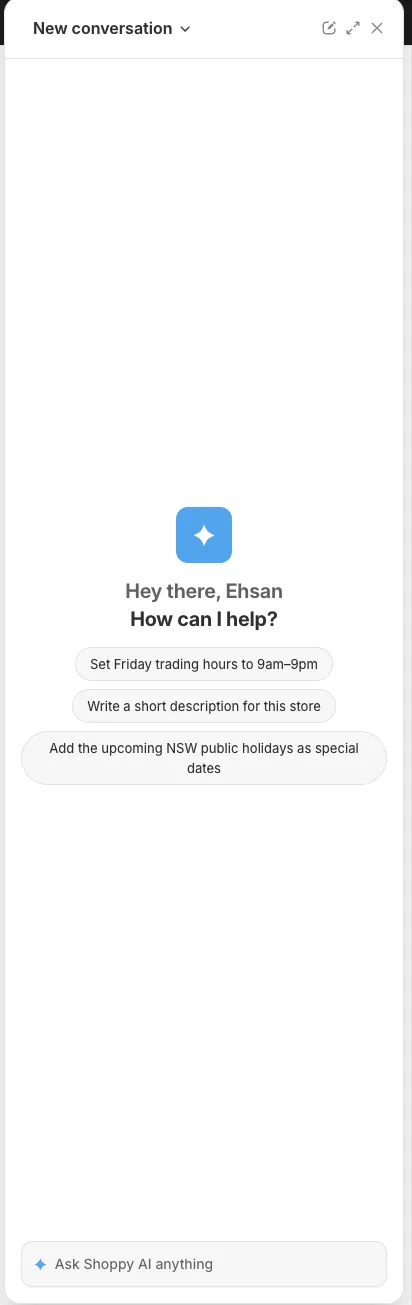
Type your request in Ask Shoppy AI anything and press Enter, or click one of the suggestions to get started.
What you can ask
Shoppy AI works with one store at a time. Name the store in your request, or open the store first and ask about “this store”.
Some things you can ask:
- “What are the trading hours for Crowsnest Store?”
- “Set Friday trading hours to 9am–9pm.”
- “Write a short description for this store.”
- “Add the upcoming NSW public holidays as special dates.”
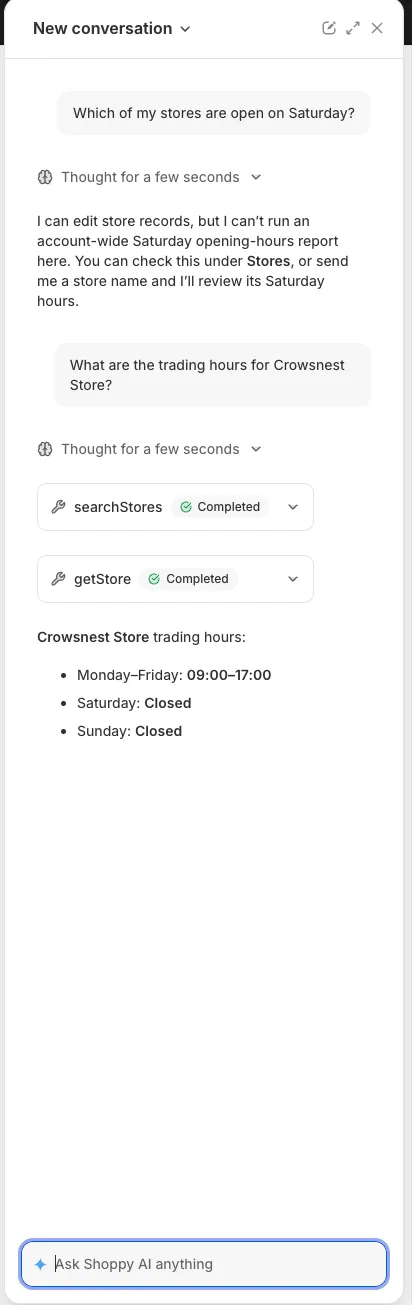
While it works, Shoppy AI shows each step it takes, such as finding the store and reading its details, with a Completed label when each step finishes. Click a step to see more.
Shoppy AI can’t yet answer questions across all of your stores at once, such as “which stores are open on Saturday”. For those, use the Stores list or Reports.
Check changes before you rely on them
When you ask Shoppy AI to change a store, check the result on the store’s page afterwards, especially for trading hours and special dates. These are shown to customers on Google and your website.
Conversations
- Each conversation is saved and named automatically. Click the conversation name at the top of the panel to switch between conversations.
- Click the New conversation icon to start again with a clean slate.
- Click the Expand icon to make the panel bigger, and × to close it.
Tips
- Choose a date range of at least a few weeks before drawing conclusions. A single day or week can be misleading.
- Compare Calls and Directions with Views. A store with lots of views but few calls or directions may have missing or wrong details, such as a phone number or opening hours.
- Send the AI insights report to everyone who manages stores, so they see the same picture each week.
- Set the inventory sync to Daily if your stock changes quickly, so the out-of-stock report stays accurate.